Risk Type Master List
Extracted from the public Notion original. Notion record created 2019-06-19. Last edited 2019-06-20.
This is reference for types of risk. I am not a risk professional but having a hierarchy of risks is the only effectively way to manage agreegation of risks and data risk as required by some regulatory guidelines.
Cross-Functional Risks
These could apply to any business capability, and need to be applied in each case:
Project Risk
The risks associated with a project. Risk management of projects is a relatively mature discipline that is enshrined in major project management methodologies.
Process Risk
The business risks associated with a particular process. Processes tend to be a focus of risk management as reducing risks in core business processes can often yield cost reductions and improved revenue.
Data Risk
Financial Risks
These are risks that can only be managed once a financial understanding of activities and operations has been established:
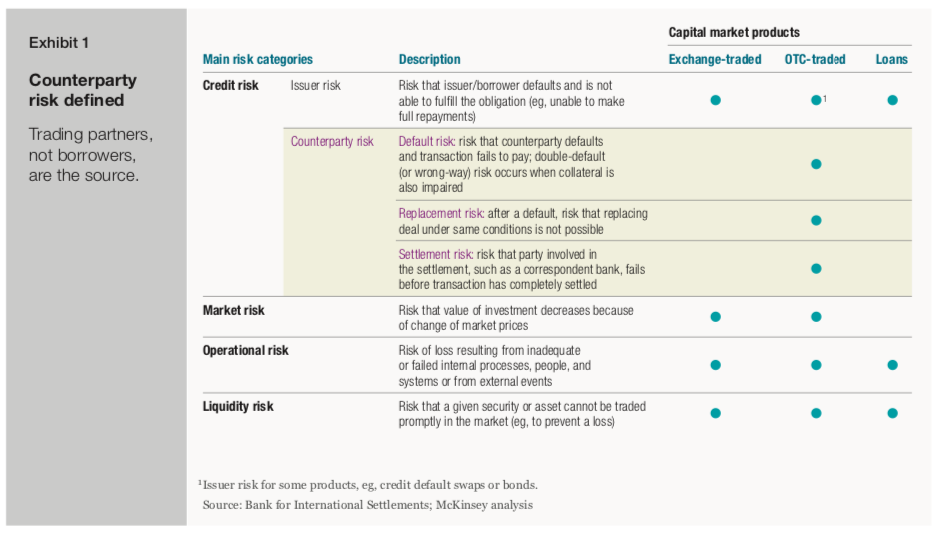
Credit Risk
The risk that those who owe you money to fail to pay. For the majority of businesses this is mostly related to accounts receivable risk.
Credit Risk
Issuer Risk
Liquidity Risk
Liqudity Risk
Risk that a given security or asset cannot be traded promptly in the market (eg. to present loss)
Financial Risk
Counterparty Risk
Introduction To Counterparty Risk
Introduction To Counterparty Risk
Updated Jun 16, 2018
Counterparty risk is the risk associated with the other party to a financial contract not meeting its obligations. Every derivative trade needs to have a party to take the opposite side. Credit default swaps, a common derivative with counterparty risk, are often traded directly with another party, as opposed to trading on a centralized exchange. Since the contract is directly with the other party, there is a greater risk of counterparty default since both parties may not have full knowledge of the financial health of the other (and their ability to cover obligations). This differs from products listed on an exchange. In this case, the exchange is the counterparty, not the single entity on the other side of the trade.
Counterparty risk gained visibility in the wake of the global financial crisis. AIG famously leveraged its AAA credit rating to sell (write) credit default swaps (CDS) to counterparties who wanted default protection (in many cases, on CDOtranches). When AIG could not post additional collateral and was required to provide funds to counterparties in the face of deteriorating reference obligations, the U.S. government bailed them out.
Regulators were concerned that defaults by AIG would ripple through the counterparty chains and create a systemic crisis. The issue was not only individual firm exposures but the risk that interconnected linkages via derivativecontracts would jeopardize the whole system.
TUTORIAL: Advanced Bond Concepts
A Credit Derivative Has Counterparty Risk
While a loan has default risk, a derivative has couterparty risk.
Counterparty risk is a type (or sub-class) of credit risk and is the risk of default by the counterparty in many forms of derivative contracts. Let's contrast counterparty risk to loan default risk. If Bank A loans $10 million to Customer C, Bank A charges a yield that includes compensation for default risk. But the exposure is easy to ascertain; it's roughly the invested (funded) $10 million.
A credit derivative, however, is an unfunded bilateral contract. Aside from the posted collateral, a derivative is a contractual promise that might be broken, thus exposing the parties to risk. Consider an over-the-counter (OTC) option sold (written) by Bank A to Customer C. Market risk refers to the fluctuating value of the option; if it is daily-mark-to-market, its value will be a function largely of the underlying asset price but also several other risk factors. If the option expires in-the-money, Bank A owes the intrinsic value to Customer C. Counterparty risk is the credit risk that Bank A will default on this obligation to Bank C (for example, Bank A might go bankrupt).
Understanding Counterparty Risk with an Interest Rate Swap Example
Let's assume two banks enter into a vanilla (non-exotic) interest rate swap. Bank A is the floating-rate payer and Bank B is the fixed-rate payer. The swap has a notional value of $100 million and a life (tenor) of five years; it is better to call the $100 million notional instead of principal because the notional is not exchanged, it is merely referenced to compute the payments.
To keep the example simple, assume the LIBOR/swap rate curve is flat at 4.0%. In other words, when the banks begin the swap, spot interest rates are 4.0% per annum for all maturities.
The banks will exchange payments at six months intervals for the swap's tenor. Bank A, the floating-rate payer, will pay six-month LIBOR. In exchange, Bank B will pay the fixed rate of 4.0% per annum. Most importantly, the payments will be netted. Bank A cannot predict its future obligations but Bank B has no such uncertainty. At each interval, Bank B knows it will owe $2 million: $100 million notional * 4% / 2 = $2 million.
Let's consider counterparty exposure definitions at two points in time - at swap inception (T = 0), and six months later (T = + 0.5 years).
At the Start of the Swap (Time Zero = T0)
Unless a swap is off market, it will have an initial market value of zero to both counterparties. The swap rate will be calibrated to ensure a zero market value at swap inception.
- The market value (at T = 0) is zero to both counterparties. The flat spot rate curve implies 4.0% forward rates, so the floating-rate payer (Bank A) expects to pay 4.0% and knows it will receive 4.0%. These payments net to zero, and zero is the expectation for future netted payments if interest rates do not change.
- Credit exposure (CE): This is the immediate loss if the counterparty defaults. If Bank B defaults, the resulting loss to Bank A is Bank A's credit exposure. Therefore, Bank A only has credit exposure if Bank A is in-the-money. Think of it like a stock option. If an option holder is out-of-the-money at expiration, default by the option writer is inconsequential. The option holder only has credit exposure to default if she is in-the-money. At swap inception, as the market value is zero to both, neither bank has credit exposure to the other. For example, if Bank B immediately defaults, Bank A loses nothing.
- Expected exposure (EE): This is the expected (average) credit exposure on a future target date conditional on positive market values. Bank A and Bank B both have expected exposure at several target future dates. Bank A's 18-month expected exposure is the average positive market value of the swap to Bank A, 18 months forward, excluding negative values (because default won't hurt Bank A under those scenarios). Similarly, Bank B has a positive 18 month expected exposure, which is the market value of the swap to Bank B but conditional on positive values to Bank B. It helps to keep in mind that counterparty exposure exists only for the winning (in-the-money) position in the derivative contract, not for the out-of-money position! Only a gain exposes the bank to counterparty default.
- Potential future exposure (PFE): PFE is the credit exposure on a future date modeled with a specified confidence interval. For example, Bank A may have a 95% confident, 18-month PFE of $6.5 million. A way of saying this is, "18-months into the future, we are 95% confident that our gain in the swap will be $6.5 million or less, such that a default by our counterparty at the time will expose us to a credit loss of $6.5 million or less." (Note: by definition the 18-month 95% PFE must be greater than the 18-month expected exposure (EE) because EE is only a mean.) How is the $6.5 million figured? In this case, Monte Carlo simulation showed that $6.5 million is the upper fifth percentile of simulated gains to Bank A. Of all simulated gains (losses excluded from the results because they do not expose Bank A to credit risk), 95% are lower than $6.5 million and 5% are higher. So, there is a 5% chance that, in 18 months, Bank A's credit exposure will be greater than $6.5 million.
Does potential future exposure (PFE) remind you of value at risk (VaR)? Indeed, PFE is analogous to VaR, with two exceptions. First, while VaR is an exposure due to a market loss, PFE is a credit exposure due to a gain. Second, while VaR typically refers to a short-term horizon (for example, one or 10 days), PFE often looks years into the future.
There are different methods to calculating VaR. VaR is a quantile-based measure of risk. For a certain portfolio and time horizon, VaR provides the probability of a certain amount of loss. For example, a portfolio of assets with a one-month 5% VaR of $1 million has a 5% probability of losing more than $1 million. Thus, the VaR can at least provide a hypothetical measure of the risk of counterparty default on a credit default swap.
The most common method to calculate VaR is historical simulation. This method determines the historical distribution of profit and losses for the portfolio or asset being measured over a previous period. Then, the VaR is determined by taking a quantile measurement of that distribution. Although the historical method is commonly used, it has significant drawbacks. The main problem is this method assumes that the future return distribution for a portfolio will be similar to that of the past. This may not be the case, especially during periods of high volatility and uncertainty.
Go Forward Six Months in Time (T = + 0.5 years)
Let's assume the swap rate curve shifts down from 4.0% to 3.0%, but remains flat for all maturities so it is a parallel shift. At this time, the swap's first payment exchange is due. Each bank will owe the other $2 million. The floating payment is based on the 4% LIBOR at the beginning of the six month period. In this way, the terms of the first exchange are known at swap inception, so they perfectly offset or net to zero. No payment is made, as planned, at the first exchange. But, as interest rates changed, the future now looks different...better to Bank A and worse to Bank B (who is now paying 4.0% when interest rates are only 3.0%).
- Current exposure (CE) at time T + 0.5 years: Bank B will continue to pay 4.0% per annum but now expects to receive only 3.0% per annum. Since interest rates have dropped, this benefits the floating-rate payer, Bank A. Bank A will be in-the-money and Bank B will be out-of-the-money.
Under this scenario, Bank B will have zero current (credit) exposure; Bank A will have positive current exposure.
- Estimating the current exposure at six months: We can simulate the future current exposure by pricing the swap as two bonds. The floating-rate bond will always be worth approximately par; its coupons are equal to the discount rate. The fixed-rate bond, at six months, will have a price of about $104.2 million. To get this price, we assume a 3.0% yield, nine semi-annual periods remaining and a $2 million coupon. In MS Excel the price = PV(rate = 3%/2, nper = 9, pmt = 2, fv = 100); with a TI BA II+ calculator, we input N = 9, I/Y = 1.5. PMT = 2, FV = 100 and CPT PV to get 104.18. So if the swap rate curve shifts in parallel from 4.0% to 3.0%, the market value of the swap will shift from zero to +/- $4.2 million ($104.2 – $100). The market value will be +$4.2 million to in-the-money Bank A and -$4.2 million to out-of-the-money Bank B. But only Bank A will have current exposure of $4.2 million (Bank B loses nothing if Bank A defaults). In regard to expected exposure (EE) and potential future exposure (PFE), both will be re-calculated (actually, re-simulated) based on the freshly observed, shifted swap rate curve. However, as both are conditional on positive values (each bank includes only the simulated gains where credit risk can exist), they will both be positive by definition. As interest rates shifted to the benefit of Bank A, Bank A's EE and PFE are likely to go up.
Summary of the Three Basic Counterparty Metrics
- Credit exposure (CE) = MAXIMUM (Market Value, 0)
- Expected exposure (EE): AVERAGE market value on future target date, but conditional only on positive values
- Potential future exposure (PFE): Market value at specified quantile (for example, the 95th percentile) on future target date, but conditional only on positive values
How Are EE and PFE Calculated?
Because derivative contracts are bilateral and reference notional amounts which are insufficient proxies for economic exposure (unlike a loan where the principal is real exposure), in general we must use Monte Carlo simulation (MCS) to produce a distribution of market values on a future date. The details are beyond our scope, but the concept is not as difficult as it sounds. If we use the interest rate swap, four basic steps are involved:
1. Specify a random (stochastic) interest rate model. This is a model that can randomize underlying risk factor(s). This is the engine of the Monte Carlo Simulation. For example, if we were modeling a stock price, a popular model is geometric Brownian motion. In the example of the interest rate swap, we might model a single interest rate to characterize an entire flat rate curve. We could call this a yield.
2. Run several trials. Each trial is a single path (sequence) into the future; in this case, a simulated interest rate years into the future. Then we run thousands more trials. The chart below is a simplified example: each trial is a single simulated path of an interest rate plotted ten years forward. Then the random trial is repeated ten times.
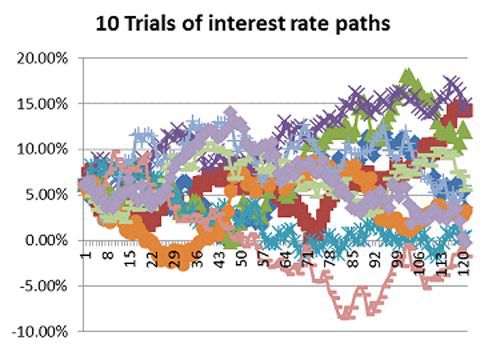
3. The future interest rates are used to value the swap. So, just as the chart above displays 10 simulated trials of future interest rate paths, each interest rate path implies an associated swap value at that point in time.
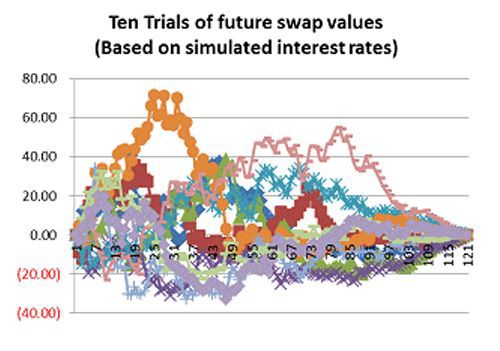
4. At each future date, this creates a distribution of possible future swap values. That's the key. See the chart below. The swap is priced based on the future random interest rate. At any given future target date, the average of the positive simulated values is the expected exposure (EE). The relevant quantile of the positive values is the potential future exposure (PFE). In this way, EE and PFE are determined from the upper half (the positive values) only.
Dodd-Frank Act
Defaults on swap agreements were one of the main causes of the 2008 financial crisis. The Dodd-Frank Act enacted regulations for the swaps market. It included provisions for public disclosures of swap trades, as well as authorizing creation of centralized swap execution facilities. Trading swaps on centralized exchanges reduces counterparty risk. Swaps traded on exchanges have the exchange as the counterparty. The exchange then offsets the risk with another party. Since the exchange is the counterparty to the contract, the exchange or its clearing firm will step in to meet the obligations of the swap agreement. This dramatically reduces the likelihood of counterparty default risk.
The Bottom Line
Unlike a funded loan, the exposure incurred in a credit derivative is complicated by the issue that value can swing negative or positive for either party to the bilateral contract. Counterparty risk measures assess current and future exposure, but Monte Carlo simulation is typically required. In counterparty risk, exposure is created with a winning in-the-money position. Just as value at risk (VaR) is used to estimate market risk of a potential loss, potential future exposure (PFE) is used to estimate the analogous credit exposure in a credit derivative. (Learn how rate changes can affect home prices and how you can keep up. See How Interest Rates Affect The Housing Market.)
Counterparty Risk
Reviewed by James Chen and Chris B Murphy
Updated Apr 23, 2019
What is Counterparty Risk
Counterparty risk is the likelihood or probability that one of those involved in a transaction might default on its contractual obligation. Counterparty risk can exist in credit, investment, and trading transactions.
Understanding Counterparty Risk
Varying degrees of counterparty risk exists in all financial transactions. Counterparty risk is also known as default risk. Default risk is the chance that companies or individuals will be unable to make the required payments on their debt obligations. Lenders and investors are exposed to default risk in virtually all forms of credit extensions. Counterparty risk is a risk that both parties should consider when evaluating a contract.
Counterparty Risk and Risk Premiums
If one party has a higher risk of default, a premium is usually attached to the transaction to compensate the other party. The premium added due to counterparty risk is called a risk premium.
In retail and commercial financial transactions, credit reports are often used by creditors to determine the counterparty's credit risk. Credit scores of borrowers are analyzed and monitored to gauge the level of risk to the creditor. A credit score is a numerical value of an individual's or company's creditworthiness, which is based on many variables.
A person's credit score ranges from 300 to 850, and the higher the score, the more financially trustworthy a person is considered to be to the creditor. Numerical values of credit scores are listed below:
* Excellent: 750 and above
* Good: 700 to 749
* Fair: 650 to 699
* Poor: 550 to 649
* Bad: 550 and below
Many factors impact a credit score including a client's payment history, the total amount of debt, length of credit history, and credit utilization, which is the percentage of a borrower’s total available credit that is currently being utilized. The numerical value of a borrower's credit score reflects the level of counterparty risk to the lender or creditor. A borrower with a credit score of 750 would have low counterparty risk while a borrower with a credit score of 450 would carry high counterparty risk.
If the borrower has a low credit score, the creditor will likely charge a higher interest rate or premium due to the risk of default on the debt. Credit card companies, for example, charge interest rates in excess of 20% for those with low credit scores while simultaneously offer 0% interest for customers that have stellar credit or high credit scores. If the borrower is delinquent on payments by 60 days or more or exceeds the card's credit limit, credit card companies usually tack on a risk premium or a "penalty rate," which can bring the interest rate of the card to over 29% annually.
Investors must consider the company that's issuing the bond, stock, or insurance policy to assess whether there's default or counterparty risk.
Investment Counterparty Risk
Financial investment products such as stocks, options, bonds, and derivatives carry counterparty risk. Bonds are rated by agencies, such as Moody's and Standard and Poor's, from AAA to junk bond status to gauge the level of counterparty risk. Bonds that carry higher counterparty risk pay higher yields. When counterparty risk is minimal, the premiums or interest rates are low, such as with money market funds.
For example, a company that offers junk bonds will have a high yield to compensate investors for the added risk that the company could default on its obligations. Conversely, a U.S. Treasury bond has low counterparty risk and therefore; rated higher than corporate debt and junk bonds. However, treasuries typically pay a lower yield than corporate debt since there's a lower risk of default.
Key Takeaways
* Counterparty risk is the likelihood or probability that one of those involved in a transaction might default on its contractual obligation. Counterparty risk can exist in credit, investment, and trading transactions.
* The numerical value of a borrower's credit score reflects the level of counterparty risk to the lender or creditor.
* Investors must consider the company that's issuing the bond, stock, or insurance policy to assess whether there's default or counterparty risk.
Examples of Counterparty Risk
When the counterparty risk is miscalculated and a party defaults, the impending damage can be severe. For example, the default of so many collateralized debt obligations (CDO) was a major cause of the real estate collapse in 2008.
Subprime Risk
Mortgages are securitized into CDOs for investment and backed by the underlying assets. One of the major flaws of CDOs before the economic crash was that they contained subprime and low-quality mortgages, whereby the CDOs were given the same high-grade ratings as corporate debt.
The high credit rating for CDOs allowed them to receive institutional investment since funds are required to invest only in highly rated debt. When borrowers began defaulting on mortgage payments, the real estate bubble burst, leaving the investors, banks, and reinsurers on the hook for massive losses. The ratings agencies received a lot of blame for the collapse, which eventually led to the financial market meltdown that defined the bear market of 2007-2009.
AIG and Insurance Risk
AIG or American International Group offers insurance products for real estate, businesses, and individuals. The company needed a bailout from the U.S. government during the financial crisis. For those who were insured by AIG, they suddenly faced an increase in counterparty risk. As a result, investors must consider the company that's issuing the bond, stock, or insurance policy to assess whether there's counterparty risk.
Counterparty risk
Exchange Rate Risk
The risk that volatility in foreign exchange rates will impact the value of business transactions and assets. Many global businesses have high exposure to a basket of currencies that can add volatility to financial results such as operating margins.
Taxation Risk
The potential for new tax laws or interpretations to result in higher than expected taxation. In some cases, new tax laws can completely disrupt the business model of an industry.
Interest Rate Risk
The risk that changes to interest rates will disrupt your business. For example, interest rates may increase your cost of capital thus impacting your business model and profitability.
Operating Model Risks
These are risks that could disrupt the overall operation of the business model:
Operational Risk
The potential of failures related to the day-to-day operations of an organization such as a customer service process. Some definitions of operational risk claim that it is the result of insufficient or failed processes. However, operational processes that are deemed to be complete and successful also generate risk.
Operational Risk
Risk of loss resulting from inadequate or failed internal processes, people, and systems or from external events
Reputation Risk
Quality Risk
The potential that you will fail to meet your quality goals for your products, services and business practices.
Resource Risk
The chance that you will fail to meet business goals due to a lack of resources such as financing or the labor of skilled workers.
Country Risk
Exposure to the conditions in the countries in which you operate such as political events and the economy.
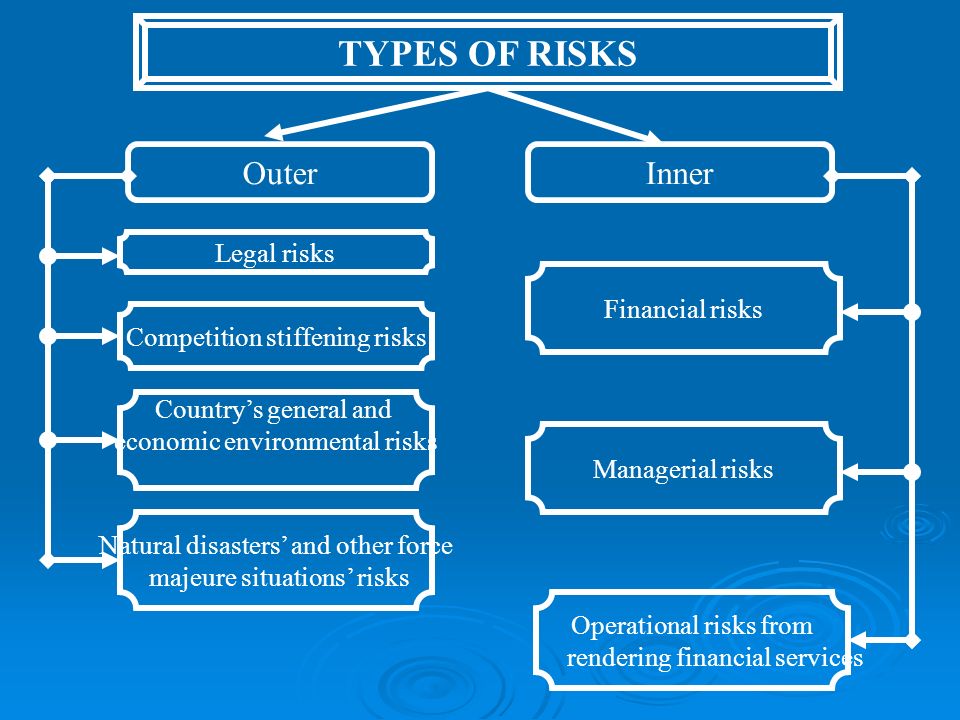
Inner Risk
Financial risks
Managerial risks
Operational risks from rendering financial services
Strategic Risks
These are risks that can only be mitigated through strategic actions:
Strategy Risk
The risks associated with a particular strategy.
Economic Risk
The possibility that conditions in the economy will increase your costsor reduce your sales.
Competitive Risk
The risk that your competition will gain advantages over you that prevent you from reaching your goals. For example, competitors that have a fundamentally cheaper cost base or a better product.
Political Risk
The potential for political events and outcomes to impede your business.
Market Alignment Risks
These are risks relating to the organisations ability to continuously align to its market:
Market Risk
Risk that value of the investment decreases because of change of market prices
Seasonal Risk
A business with revenue that's concentrated in a single season such as a ski resort.
Reputational Risk
Reputational risk is the chance of losses due to a declining reputation as a result of practices or incidents that are perceived as dishonest, disrespectful or incompetent. The term tends to be used to describe the risk of a serious loss of confidence in an organization rather than a minor decline in reputation.
Strategic Goals & Transformation Risks
These are risks relating to the impact of not achiving the organisarions goals in relation to targets and transformation change:
Program Risk
The risks associated with a particular business program or portfolio of projects.
Innovation Risk
Risk that applies to innovative areas of your business such as product research. Such areas may require adapting your risk management practices to fast paced and relatively high risk activities.
Outer Risk
Legal risks
Competition stiffening risks
County's general and economc environment risk
Natural disasters' and other force majeure situations' risks
Complience Risks
These are risks relating to the impact of non-complience with external obligations:
Compliance Risk
The chance that you will break laws or regulations. In many cases, a business may fully intend to follow the law but ends up violating regulations due to oversights or errors.
Legal Risk
The chance that new regulations will disrupt your business or that you will incur expenses and losses due to a legal dispute.
Risk References used to create master risk list
The following references have been reviewed and used when creating these pages on types of risk:
- John Spacey, 20 Types of Business Risk: https://simplicable.com/new/business-risk
- Cody Mitchell, Introduction to Counterparty Risk: https://www.investopedia.com/articles/optioninvestor/11/understanding-counterparty-risk.asp
Additional material has been created by Matthew De George
The following google images were also used: